

Let's go ahead and get this out of the way. Reports aren't the most exciting thing to talk about. Most people don't enjoy reviewing reports, much less generating them. However, regardless of your personal feelings towards reports, there's no denying that they play a pretty vital role in most organizations. That's why we're going to take a look at some cool reports you can easily create in PDQ Inventory to impress your boss or bosses.
PDQ Inventory built-in reports
Before we dive into creating custom reports, let first take a quick look at some of the reports that are included with PDQ inventory.
You'll find the built-in reports by clicking on the Reports directory in the navigation tree.

Here you'll find a range of useful reports that come bundled with PDQ Inventory, including software and hardware reports. The best part is that you can use these reports as templates for your own reports, or you can duplicate and customize these reports to suit your needs.
Simply double-click on a report to generate it. Here's what the Application Counts report looks like.

The Application Counts report lists all the applications installed in your environment and returns how many computers each application is installed on. You can view how the report was built by clicking on Define Report at the top of the report window.

This report is only made up of two columns, the Name column from the Application table and the Computers > Count column from the Computer table.
You can print or save these reports as needed. As I mentioned, you can also customize these reports by adding or removing columns. Additionally, you can also add filters to these built-in reports by clicking on the Filters tab.
Creating custom reports
The reports that come included with PDQ Inventory cover a lot of the basics. However, you'll probably come across situations when you need to gather more information than what's included with the basic reports. Thankfully, creating custom reports in PDQ Inventory is pretty simple and can often be done with just a couple of clicks.
With PDQ Inventory open, let's go over the basics of creating a custom report. In this example, we'll create a report that will return the names and IP addresses of workstations in PDQ Inventory, excluding all servers.
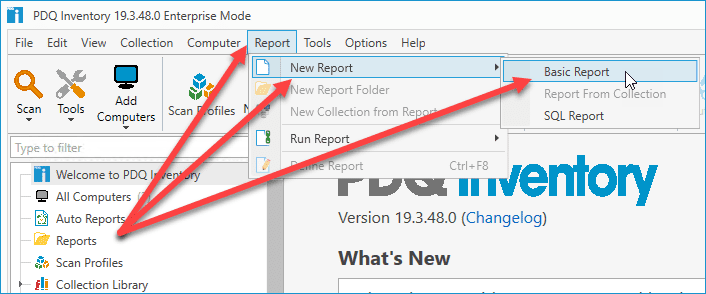
Click Report > New Report > Basic Report. This will open the New Report window.
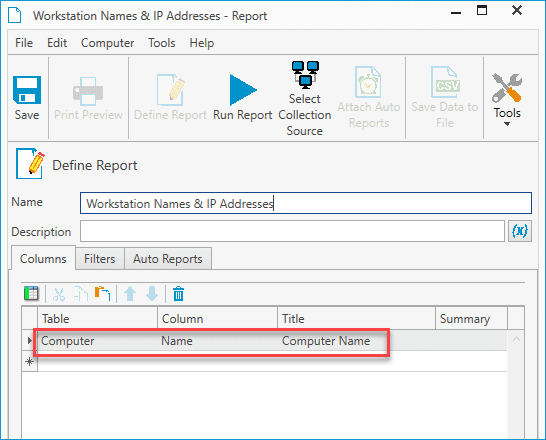
Give the report a name. I've named mine Workstation Names & IP Addresses.
By default, the first column of the report should be populated with Computer > Name > Computer Name. If not, add this column manually.
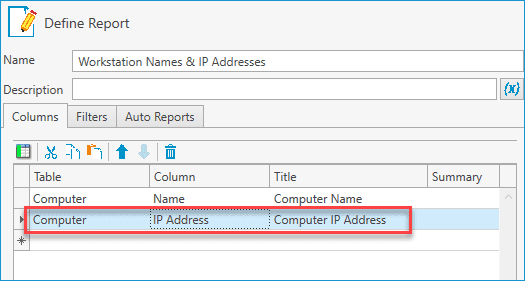
Click in the next row and add this column: Computer > IP Address > Computer IP Address.
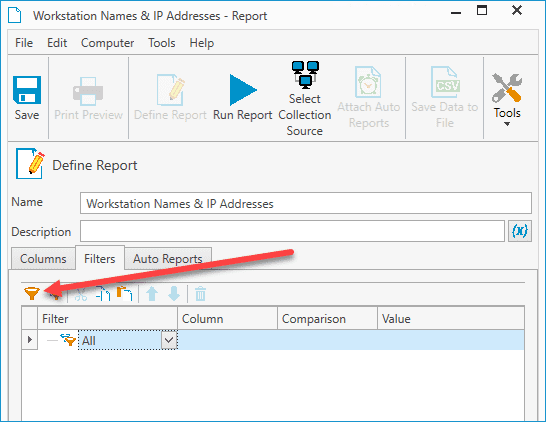
Now we need to filter out servers. Click the Filters tab.
By default, the All filter should already be listed. Click the Add Value Filter button.
Use this filter: Member of Collection > Name > Equals > Workstations.
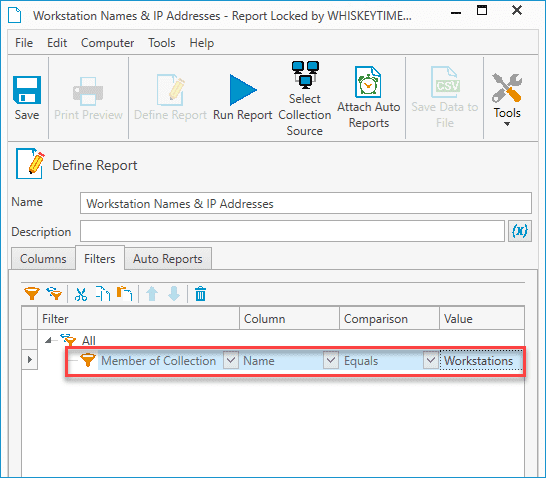
Lastly, click Save and Run Report to view the results.


Congratulations, you've just created a custom report!
If we had run the report without adding the workstations container filter, the report would have also returned any server names and IP addresses that are in PDQ Inventory. Remember, filtering data is a crucial part of creating reports.
Before we move on, let's go over my favorite method of creating reports. PDQ Inventory allows you to convert pre-built or custom collections into reports. Often, the data users need in a report is already contained in a collection. Converting collections into reports is the quickest way to generate reports. Here's how to do it.
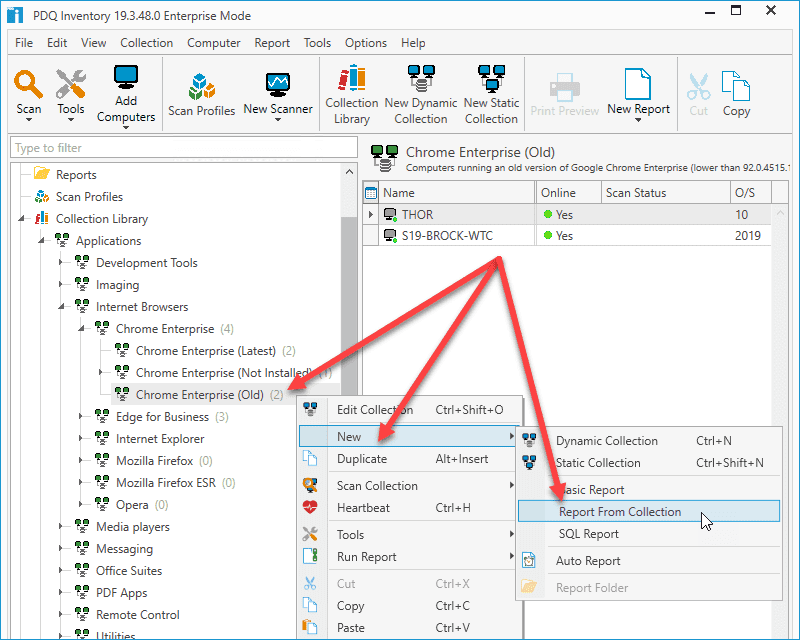
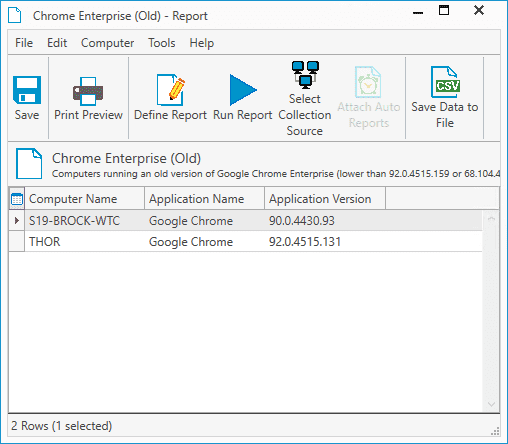
Right-click on a collection and select New > Report From Collection. In this example, I'll use the Chrome Enterprise (Old) collection from the Collection Library.
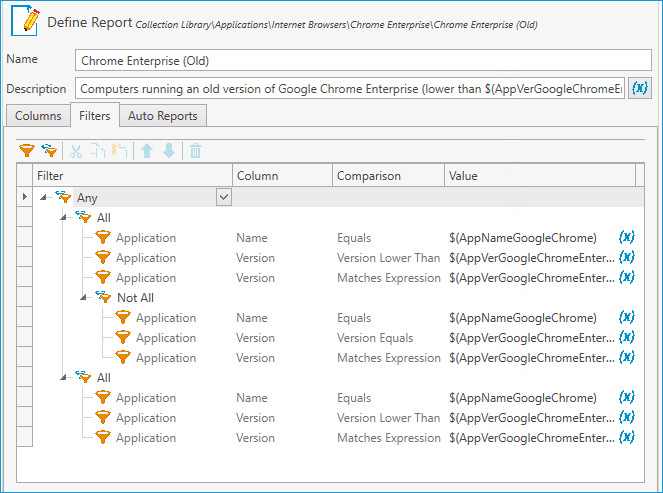
The report window will open containing the filters from the collection.
At this point, you can save and run the report or customize the report by adding or removing columns and filters. I'll customize my reporting by adding the following two columns.
Applications > Name > Application Name
Application > Version > Application Version
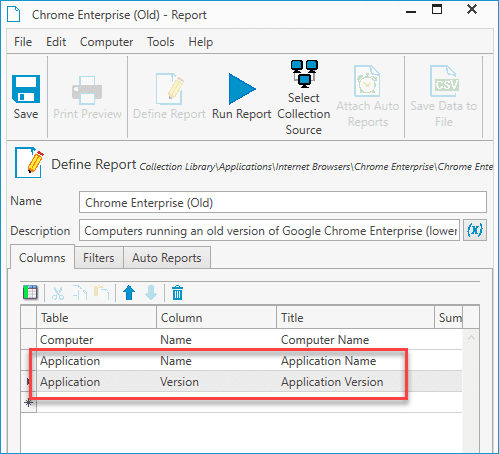
Now, click Save and Run Report to view the results of the report.
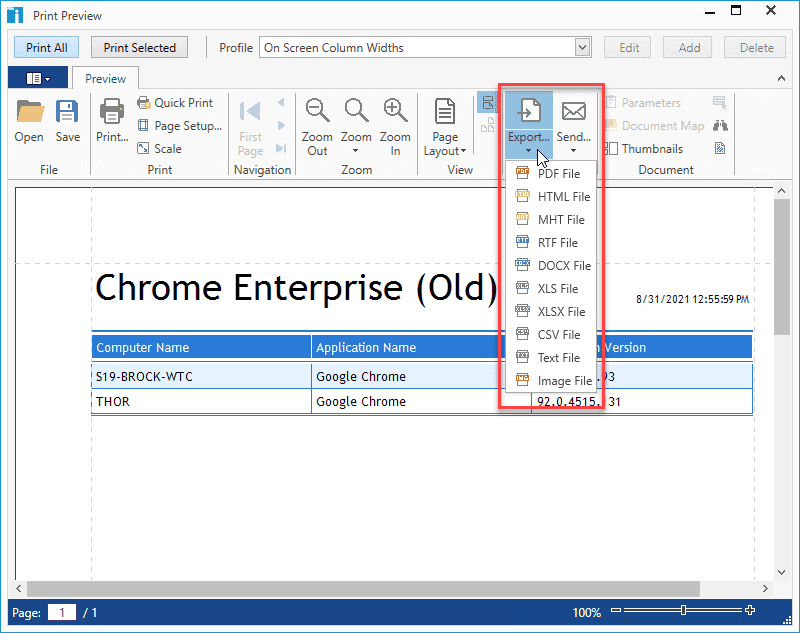
Now that we've generated the report, we can save the data to a CSV file with the Save Data to File button, or we can click the Print Preview button, which will allow us to print the report or export the report in several different formats.


Creating reports from collections is efficient and simple. Best of all, with dozens upon dozens of collections built into PDQ Inventory, there's a good chance a collection already exists that you would want as a report.
More of a PDQ Connect fan?
We've got you covered there, too. Here's how to generate custom reports in PDQ Connect to impress your boss.
Auto Reports
If you have reports that consistently need to be generated on a schedule, you'll want to attach them to an Auto Reports schedule.
Auto Reports in PDQ Inventory allow you to automate your report workflow. With Auto Reports, you can schedule when you want reports to be generated as well as where you want them to be saved or sent.
To use Auto Reports in PDQ Inventory:
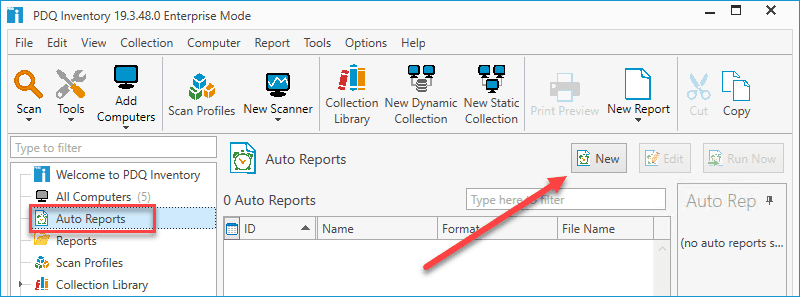
Click on Auto Reports in the navigation tree.
Click New.
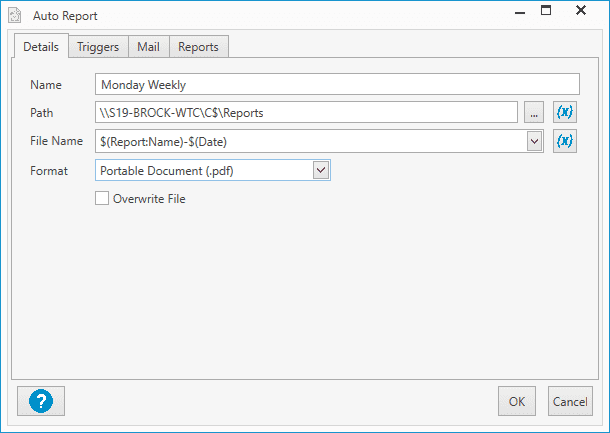
Name your auto report. Keep in mind that you can attach multiple reports to one auto report profile. I've named mine Monday Weekly, which lets me know when the reports will be generated with this schedule.
If you want to save the file to a directory, enter or browse out to the path of the directory.
Enter a file name for the saved file. If you click the drop-down arrow next to the File Name field, you'll be given a few report name scheme options, or you can create your own.
Select the file format for the reports.
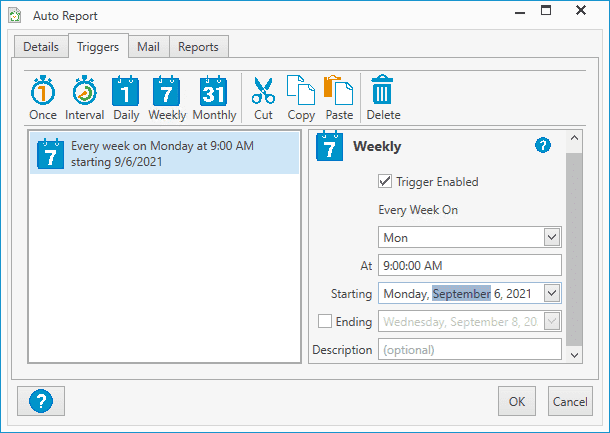
Click the Triggers tab.
Configure the triggers for when you want the reports to be generated. I'm using a weekly trigger and configuring it to go off on Mondays at 9 AM.
If you want to have the report emailed, click on the Mail tab and configure the settings. You'll need to have your SMTP settings configured in Preferences before you can use this option.
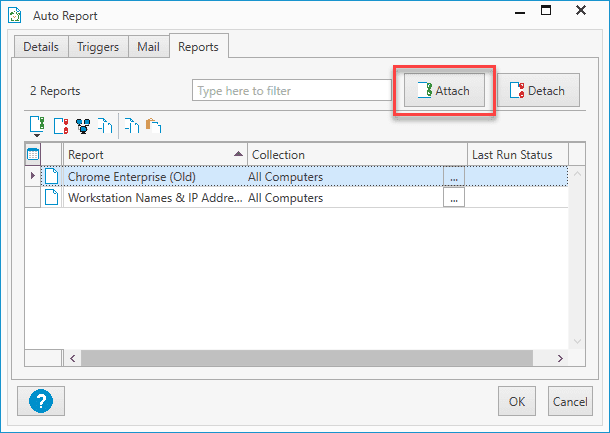
Lastly, click on the Reports tab, and then click Attach. Select the reports you want attached to this Auto Reports profile and then click OK when finished.


You should see your newly created auto reports profile in the Auto Reports window. Why generate reports manually when you can have PDQ Inventory do it for you?
Now that we've covered the basics of creating reports, let's look at some examples that will help you impress your boss.
Display adapters report
This report returns each device's display adapter.

Filters

This report may be simple, but the information it provides can be extremely useful. If you've ever walked across an entire college campus with the wrong display adapter cable in tow, you know what I mean (definitely not a real-world example by yours truly). Additionally, if you support remote workers at your organization, this information will help you track what cables and adapters each remote employee needs.
Out-of-date software report
This report returns a list of out-of-date software and the computer it's installed on.
Columns

Filters

This report makes it easy to audit your computers to ensure their software is up-to-date, but it can also contain tons of information, making it difficult to read. To help make your reports a little easier to digest, you can group the data by columns. To do this, after you run the report, right-click on the column you want to group by and click Group By This Column.

After grouping by the Computer Name column, the report will look like this, making it easier to digest the information.

Computers missing Windows updates Report
This report is similar to the Out-Of-Date Software report, but it focuses solely on computers with missing windows updates.
Columns

Filters

And here are the results.

Local Admin users report
This report will return a list of computers with the users who are in their local Administrators group. It will also filter out common members of the Administrators group, such as Domain Admins and the Administrator user.
Columns

Filters

I recommend grouping that you group this report by the Computer Name column once you run it.

PDQ Deploy deployments report
This report will return information about your PDQ Deploy deployments which have occurred within the last 24 hours.

Filters

Wrapping up
Sure, reports may not be the most exciting topic to talk about. But in many organizations, they're still necessary. And while using PDQ Inventory won't make reports obsolete, it will make generating them much easier.
Looking for more ways to impress your boss and land that fancy promotion? Here are a few more impression-worthy protips for PDQ Deploy & Inventory.


