

Audit. That single word strikes fear into the hearts of even the most veteran sysadmin. The term implies effort, time, and — worst of all — walking. But what if it didn’t have to? What if you could casually audit all your Windows devices and their software installs from the comfort of your meticulously contoured derriere cushion? Join me on a journey of enlightenment, and I’ll show you how to make your audits just as casual as casual Fridays with the help of PDQ Inventory.

Managing a remote or hybrid fleet?
PDQ Connect brings the best of Deploy & Inventory to the cloud with an agent-based approach so that you can manage hard-to-reach devices from anywhere. It also adds remote desktop, vulnerability management, macOS support, and more — all in a single pane of glass.
Narrowing down your audit needs
Before an audit, it’s vital to define your objectives. What’s the goal of the audit? What’s the bare minimum information necessary to help you achieve that goal? What format would best portray the information?
It’s very easy to start an audit by collecting way more information than necessary. But overwhelming yourself, or an auditor, with too much data only creates more work in the long run, which is the opposite of what we want. And I would never recommend intentionally overwhelming an auditor with more information than they need in hopes they’ll overlook some shortcomings you didn’t want them to see (not based on a real-life experience).
For this article, we’ll do a general audit of endpoint hardware and software, identifying needs and uses. Here are some of the data points we’re interested in gathering for our general audit:
Workstation and server count
Hardware types
Operating systems
Installed RAM
Disk usage
Critical disk usage
App installs
If you’re looking for help with a PCI audit, check out our guide on how to pass your next PCI audit with PDQ Inventory and Deploy.
How to track workstation and server counts
One of the essential pieces of information for an IT department is an accurate count of how many workstations and servers it manages. This data is a primary metric used to determine the expansion of an IT department. With an accurate count of managed devices, managers can quickly assess if their sysadmins are vastly outnumbered by the devices they manage.
Gathering accurate computer and server counts without the right tools can be a painstaking task involving phone calls, detective work, and walking (shudders). But, with a network inventory management tool like PDQ Inventory, it’s super easy — barely an inconvenience. Here’s how easy it is with PDQ Inventory.
With PDQ Inventory open, you’ll see the navigation tree on the left side of the console. Next to All Computers, there’s a number surrounded by parentheses, which indicates the total number of devices managed by PDQ Inventory. See how easy that was? But we can take it a step further by generating reports that list all of your servers and workstations.
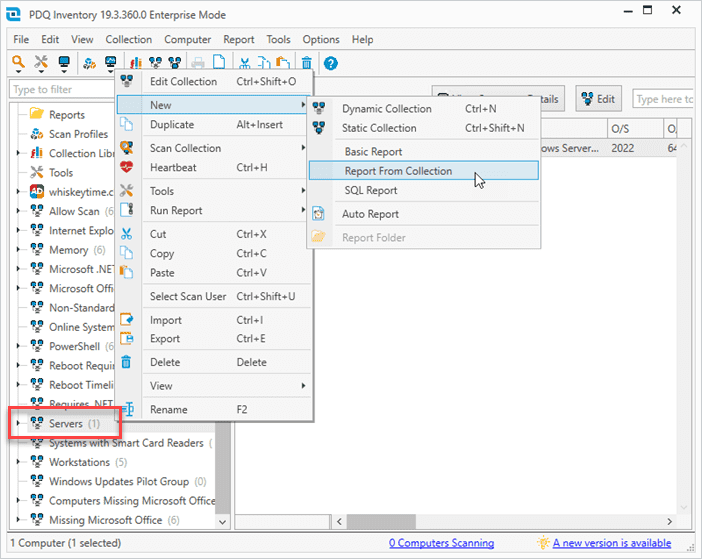
In PDQ Inventory, scroll down the navigation tree, right-click on the Servers collection, then click New > Report From Collection.
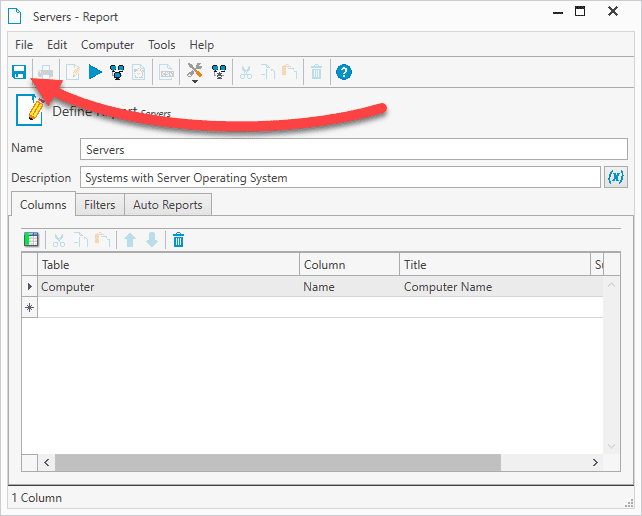
Review the report settings, and add any additional information to the report. When finished, click the Save button, then close the report.
Repeat this process using the Workstations collection to create a new report that returns your managed workstations.


When you’ve finished creating the reports, click the Reports button in the navigation tree, and locate the Servers and Workstations reports (if you kept the default names). These two reports provide all the servers and workstations PDQ Inventory currently manages. They use the same filtering logic utilized by the collections from which they were generated.
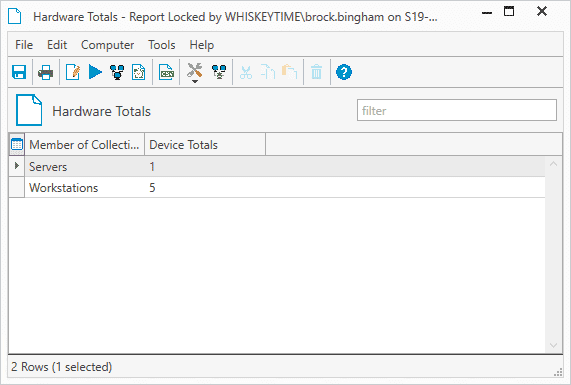
If you just need to generate a report that lists the totals of managed workstations and servers, here’s how.
Click Report > New Report > Basic Report from the top menu in PDQ Inventory.
Name the report.
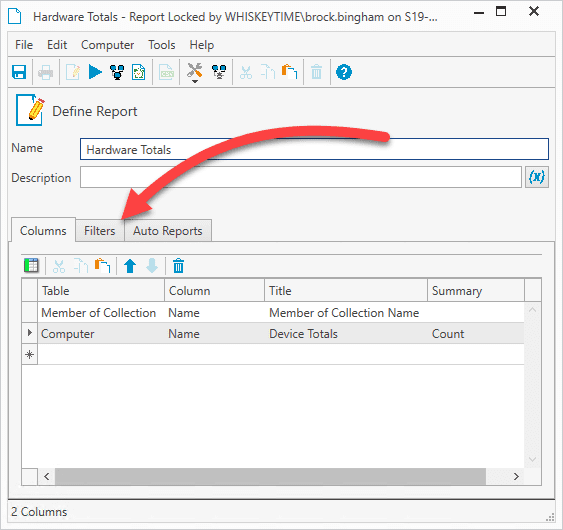
Add the following two columns:
Member of Collection | Name | Member of Collection Name
Computer | Name | Device Totals | Count
Click on the filters tab.
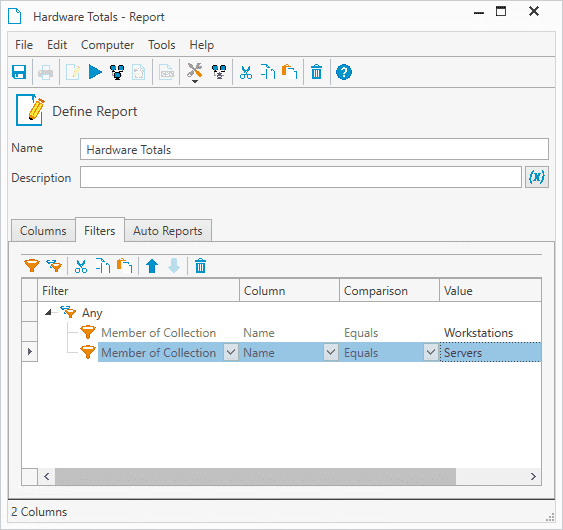
Add the following filters:
Any
Member of Collection | Name | Equals | Workstations
Member of Collection | Name | Equals | Servers
Click the Save button, then click the Run Report button to view the results.


Tracking hardware makes and models
As your organization grows, you will accumulate many different makes and models of computers. PDQ Inventory simplifies tracking the various devices deployed on your network. Here’s how to create a report in PDQ Inventory that returns the manufacturer, model, and computer name of your devices.
From the top menu in PDQ Inventory, click Report > New Report > Basic Report.
Name the report.
Add the following columns in addition to the default Computer Name column:
Computer | Manufacturer | Computer Manufacturer
Computer | System Version | Computer System Version (model)
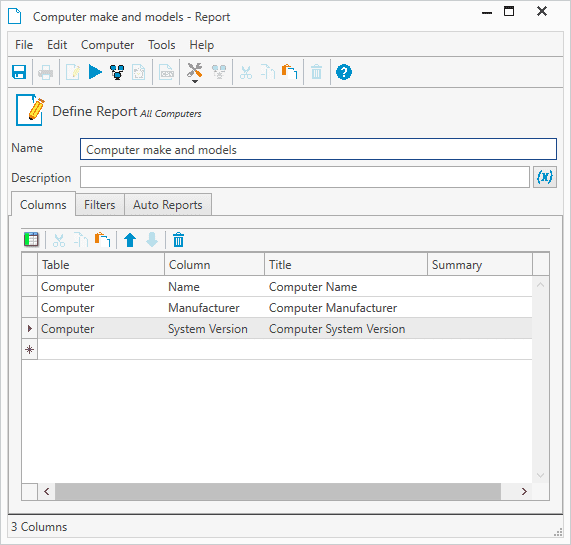
Click Save to save the report, then click Run Report to view the results.

You can right-click on the column headers to group the report’s results by manufacturer or model to make the information easier to digest.
How to audit operating systems with PDQ Inventory
PDQ Inventory includes a prebuilt Operating Systems report that returns the various operating systems deployed on your network and the number of devices using each OS version.

The Operating Systems report is a great resource when auditing your operating systems, especially when you have devices running operating systems reaching their end-of-life date. However, we can create a report that includes all devices and groups them by their OS version, which is a bit more helpful when auditing operating systems.
Click Report > New Report > Basic Report from the top menu.
Give the report a name, and if you’re feeling ambitious, add a description. The more information, the better.
By default, the computer name column should already be added. Add a second column with the Computer | O/S Version | Computer O/S Version data.
Click the Save button when finished, then click the Run Report button.

In the report preview window, right-click the Computer O/S Version column header, and click Group By This Column.

Click the Print button.
Click the Export button, then click the file format of your choice. I’ll choose PDF for this example.
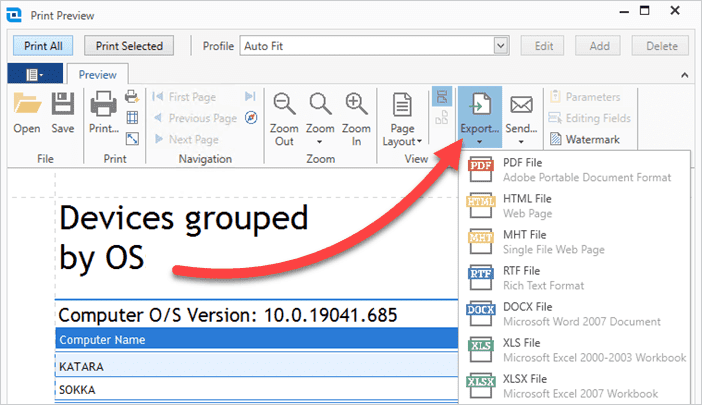
Enter the path and the file name for the report, then click OK to save it.


You now have a report that groups all your systems in their respective OS versions. You can take this report further and filter out operating systems you don’t want to return information on. I recommend doing this if you return hundreds or thousands of results.
How to get accurate RAM counts from your workstations
The amount of RAM in a computer can drastically impact its performance. 4 GB of RAM in a Windows 7 computer was often sufficient. While meeting Microsoft’s minimum requirements, 4 GB of RAM in a computer running Windows 10 or Windows 11 struggles to keep up with a moderate workload.
PDQ Inventory includes a prebuilt Memory Modules report, but we can enhance this default report by modifying it a bit to meet the needs of our audit.
Open the Reports menu in PDQ Inventory.
Right-click on the Memory Modules report, then click Duplicate.
Right-click on the duplicated report, then click Define Report.
Rename the report.
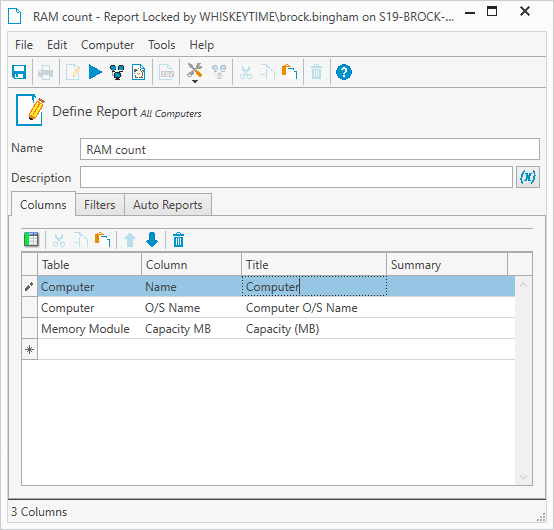
Right-click on the first row of the table, and click Add Column.
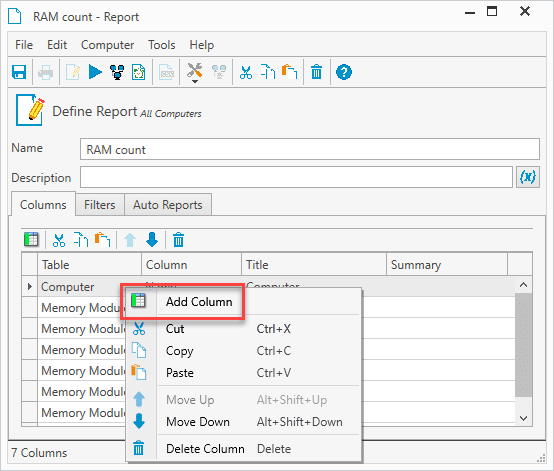
Set the column to Computer | O/S Name | Computer O/S Name.
I recommend keeping the Memory Module | Capacity MB|Capacity (MB) column, but you can keep or remove the rest of the columns, depending on your needs. Your table should look like this unless you kept more columns:
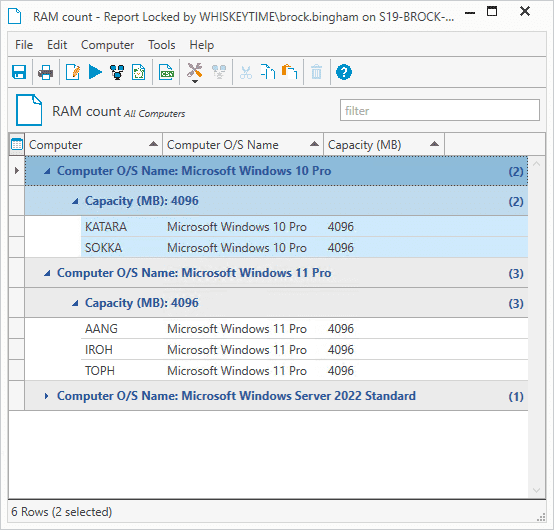
Click the Save button, then click the Run Report button to view the results.
Lastly, consider grouping your report by Computer O/S Name and then by Capacity (MB) to quickly identify which computers have enough RAM for their respective OS.


With this report, you can effectively justify purchasing more RAM for your workstations by quickly identifying systems that don’t meet or barely meet the minimum OS requirements.
Monitoring disk usage with PDQ Inventory
Disk usage is another critical detail to monitor on your workstations and servers. High-resolution photos and videos quickly chew through a device’s available disk space, especially if your users aren’t utilizing cloud storage. When a computer approaches its maximum capacity, things go downhill rapidly. Even deleting a file to free up disk space can be problematic if you don’t have enough free space to support the process.
Again, PDQ Inventory comes in clutch by providing a built-in disk usage report called the Logical Disks report. You can run this report and sort by the Free % column to identify which devices are running low on disk space.

If you’d rather not generate a report to monitor disk usage, PDQ Inventory still has you covered. PDQ Inventory also includes a couple of dynamic collections that group devices with less than 20% or less than 10% free disk space left. To view these collections, expand Collection Library > Hardware > Disks in the navigation tree.

As devices reach these thresholds, they’ll automatically be assigned to these dynamic collections.
How to audit application installs
Tracking software installs can seem like an impossible task. And without the right tools, it can be. But PDQ Inventory makes tracking application installs easy.
There are a couple of ways to monitor application installs with PDQ Inventory: collections and reports.
The Collection Library in PDQ Inventory comprises hundreds of prebuilt collections, many built around tracking popular application installs. These collections let you quickly grasp the apps installed on your managed devices. To view these collections, expand Collection Library, then expand Applications. Here you’ll find collections for apps such as Chrome, Notepad++, Visual Studio Code, GIMP, 7-Zip, VLC Media Player, and tons more.

PDQ Inventory also includes prebuilt reports for monitoring application installs. To view these reports, click the Reports button in the navigation tree. Here you’ll find the Application Counts and the Applications reports.
The Application Counts report returns applications that are installed on your devices and provides a total of how many devices each application is installed on.

The Applications report returns all the applications installed on each computer. This report can be a bit overwhelming at first, but if you group it by the application or device name, it becomes super easy to identify what is installed and where.

Your boss will think you’ve been working extra hard when he sees these reports. Don’t worry; your secret’s safe with me.
If you are looking for other reports to impress your boss, we’ve got you covered.
Don’t let audits get you down
The best way to approach an audit is to have everything ready before the process even starts. PDQ Inventory makes it easy to create the collections and reports you need to be successful in your next audit. Best of all, you can do it all from the comfort of your office chair.
If you’ve got an audit coming up, it’s not too late. You can try PDQ Inventory for free for 14 days. You’ll be up and running in minutes and have plenty of time left over to think about all the awkward conversions with coworkers that you’ll be able to avoid thanks to PDQ Inventory.


